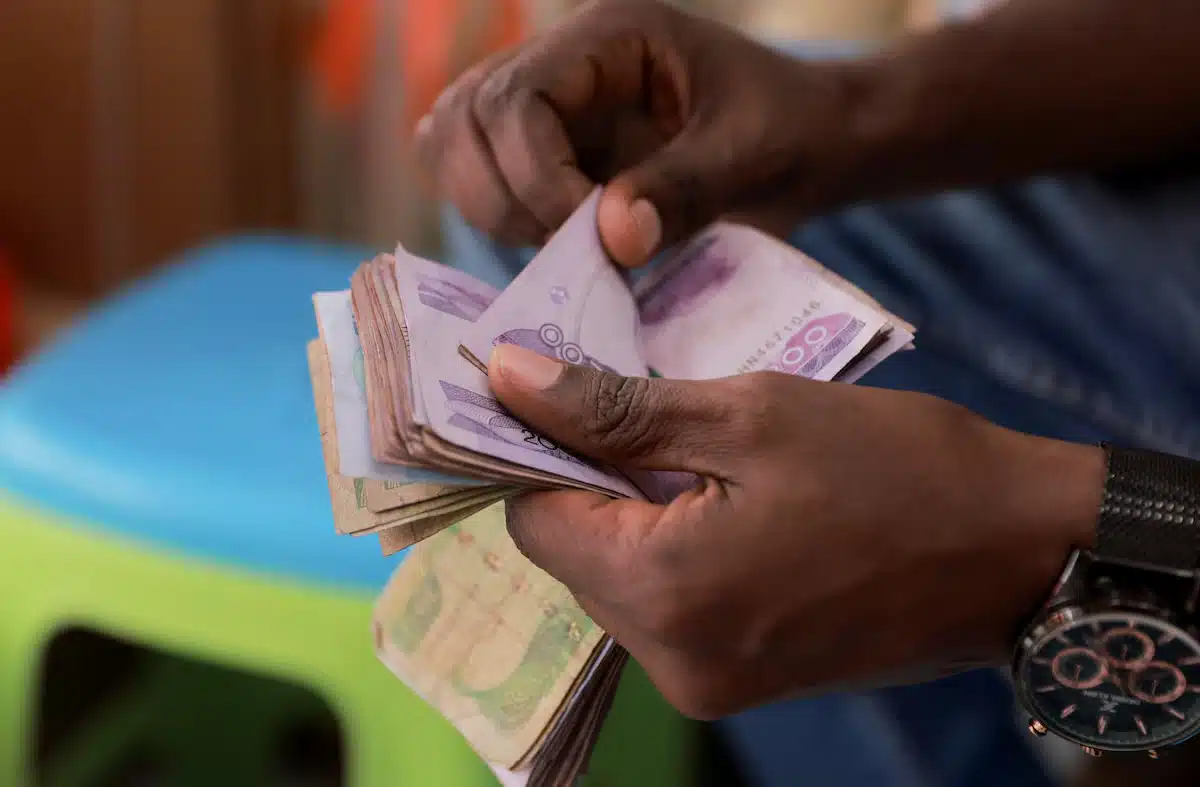

There’s a fact in Kenyan banking that often gets overlooked: most Kenyans repay their loans. Four out of five, in fact. The problem isn’t that Kenyans don’t pay. It’s that the share that doesn’t has been quietly rising, and it’s now high enough to put real pressure on the system.
For most of the last decade, Kenya’s banking sector was one of the most robust in sub-Saharan Africa. Profitable, well-capitalised, increasingly digital. The story was a good one.
That story hasn’t collapsed, but it has developed a serious crack.
The industry’s gross non-performing loan ratio, that is, the share of loans where borrowers have stopped repaying, held at roughly 11% for most of the previous decade. Since 2022, it climbed steadily, peaking at 17.6% in August 2025, the highest in over a decade and more than six percentage points above Kenya’s own historical norm.
Kenya didn’t have a persistent bad-loan problem. It developed one, and relatively quickly.
By March 2026, the ratio stood at 15.6%, according to the Central Bank of Kenya’s April 2026 Monetary Policy Committee statement, down from a peak of 17.6% in August 2025, though it ticked up marginally from 15.4% in December 2025. That looks like an improvement. But it is not a recovery. An NPL ratio above 15% remains elevated by any reasonable standard, and the conditions that drove it up are only partially reversing.
This appears as a signature of compounding stress; and understanding it requires tracing the chain back to where it actually started.
What “non-performing” actually means, and why it matters
An NPL is a loan where the borrower has stopped making payments for at least 90 days. When a bank’s NPL ratio rises, it means more of the money it lent out is in doubt. That forces the bank to set aside more funds as provisions (a buffer against potential losses) which eats into profits and reduces the capital available for new lending.
A good analogy to employ here is that, at its August 2025 peak of 17.6%, for roughly every KSh100 ($0.77) lent out, KSh17.60 ($0.14) was not coming back on schedule. That constrains credit. And constrained credit slows down the businesses and households that depend on it.
This is why NPL ratios are among the most closely watched indicators in any banking system. They not only measure how individual banks are doing; they also reveal how much stress the broader economy is quietly transmitting into the financial sector.
The two factors that broke the loan book
Kenya’s NPL rise didn’t happen in isolation. Two forces converged and reinforced each other.
The rate shock
In February 2024, the Central Bank of Kenya (CBK) raised its benchmark rate to 13% and held it there for five consecutive months, to defend the shilling and anchor inflation that had peaked at 7.7% in 2023.
It worked, eventually. But the cost was steep. Higher rates meant higher monthly repayments on existing loans, and fewer businesses could qualify for new ones. Commercial bank lending rates peaked at 16.64% in January 2025. Credit became expensive precisely when many companies needed breathing room.
The CBK has since cut its benchmark rate ten consecutive times, bringing it to 8.75% in February 2026. Average commercial bank lending rates had eased to 14.7% by March 2026. But rate cuts take time to filter through to actual loan performance. The damage to asset quality had already compounded.
The government’s unpaid bills
This is the part of the story that gets less attention than it deserves. As of June 2024, Kenya’s National Treasury had accumulated pending bills to contractors and suppliers worth KSh235 billion ($1.82 billion). Behind each one was a contractor who hadn’t been paid, a supplier who couldn’t cover payroll, a subcontractor who stopped servicing their bank loan.
The manufacturing, construction, real estate, and wholesale and retail trade sectors were hit the hardest; these were exactly the sectors most dependent on government procurement. When the state is slow to pay, those businesses are the first to default on their lenders. The result was a chain reaction. Government delays became contractor cash shortages, which became bank NPLs.
George Munga Amolo, Managing Partner at AMG Consulting Group, put it plainly in a January 2026 interview with CNBC Africa: “The reason why NPLs went up in 2025 was largely due to government pending bills and decreased disposable income among households.”
Inside the numbers: Who is carrying what
The aggregate picture is damaging enough. The bank-level picture is more so.
KCB Group
Kenya’s largest bank by assets, had a gross NPL ratio of 19.9% in Q1 2025, which equates to nearly one in five loans in distress. Its gross non-performing loans reached KSh233.3 billion (~$1.8 billion), up 13.6% year-on-year, even as its loan book grew by only 2.6% in the same period. KCB’s exposure spans Kenya, Uganda, and the DRC, and deterioration across all three markets contributed to the result.
Equity Group
Kenya’s second-largest bank saw its gross non-performing loans rise 16.2% year-on-year to KSh139.4 billion (~$1.1 billion) in H1 2025. Its NPL ratio climbed to around 15% from 10% two years earlier, which is a 50% relative deterioration across a period when loan book growth remained moderate.
Absa Bank Kenya
The bank recorded an NPL ratio of 13.1% in Q1 2025, up from 11.1% a year prior, with gross non-performing loans climbing 13.4% to KSh44 billion ($340 million), while its loan book actually contracted by 4%.
That last detail is significant. When banks pull back on lending but still see NPL ratios climb, it means the existing stock of loans is deteriorating faster than banks can manage it. The weighted average gross NPL ratio across Kenya’s ten listed banks reached 14.0% in Q1 2025, remaining nearly three percentage points above the ten-year average.
Banks are provisioning more, but at a cost
One of the more important numbers in this story is the NPL coverage ratio: the share of bad loans that banks have set aside provisions to cover. In Q1 2025, the market-weighted average coverage ratio for listed banks rose to 66.3%, up from 62.7% a year earlier. KCB’s coverage ratio rose to 74.4%, and Stanbic’s to 72.3%.
Higher coverage means banks are better protected against actual losses. That’s prudent risk management. But every shilling set aside as a provision is a shilling not available as profit or new capital. Banks are absorbing the NPL wave internally, which keeps the system stable in the short term, but it compresses returns and creates pressure for efficiency elsewhere.
The Kenya Bankers Association, in its State of the Banking Industry Report 2025, noted that elevated credit risk has led banks to adopt “a more cautious lending approach… even as SMEs, which account for over 95% of businesses and a large share of employment, face weakening repayment capacity”.
Where things stand now: A slow, uneven recovery
The most current data offers a guarded sense of improvement. The industry NPL ratio fell from its 17.6% peak in August 2025 to 16.5% in November 2025, and further to 15.5% in January 2026. As of March 2026, the CBK’s Monetary Policy Committee placed it at 15.6%, a marginal tick upward, suggesting the recovery is not yet linear.
Central Bank of Kenya Governor Kamau Thugge acknowledged early signs of improvement in December 2025, noting that declines in non-performing loans had been recorded across mining, energy and water, personal and household, and transport sectors. “Banks have continued to make adequate provisions for the NPLs,” he said.
Private sector credit growth, one of the clearest leading indicators of economic health, has also started moving in the right direction. It rose to 8.1% in March 2026, up from 7.4% in February and a contraction of -2.9% at the beginning of 2025, notably a meaningful turnaround.
Commercial banks advanced KSh228.2 billion ($1.76 billion) in new net loans to businesses and households in 2025, reversing a KSh53.6 billion ($414 million) contraction the year prior.
But credit officers have long memories. Moody’s maintained a stable outlook on Kenya’s three largest banks in February 2026, citing strong capital buffers, but the NPL ratio remains well above the global average for comparable frontier markets, which analysts estimate at around 5-8%.
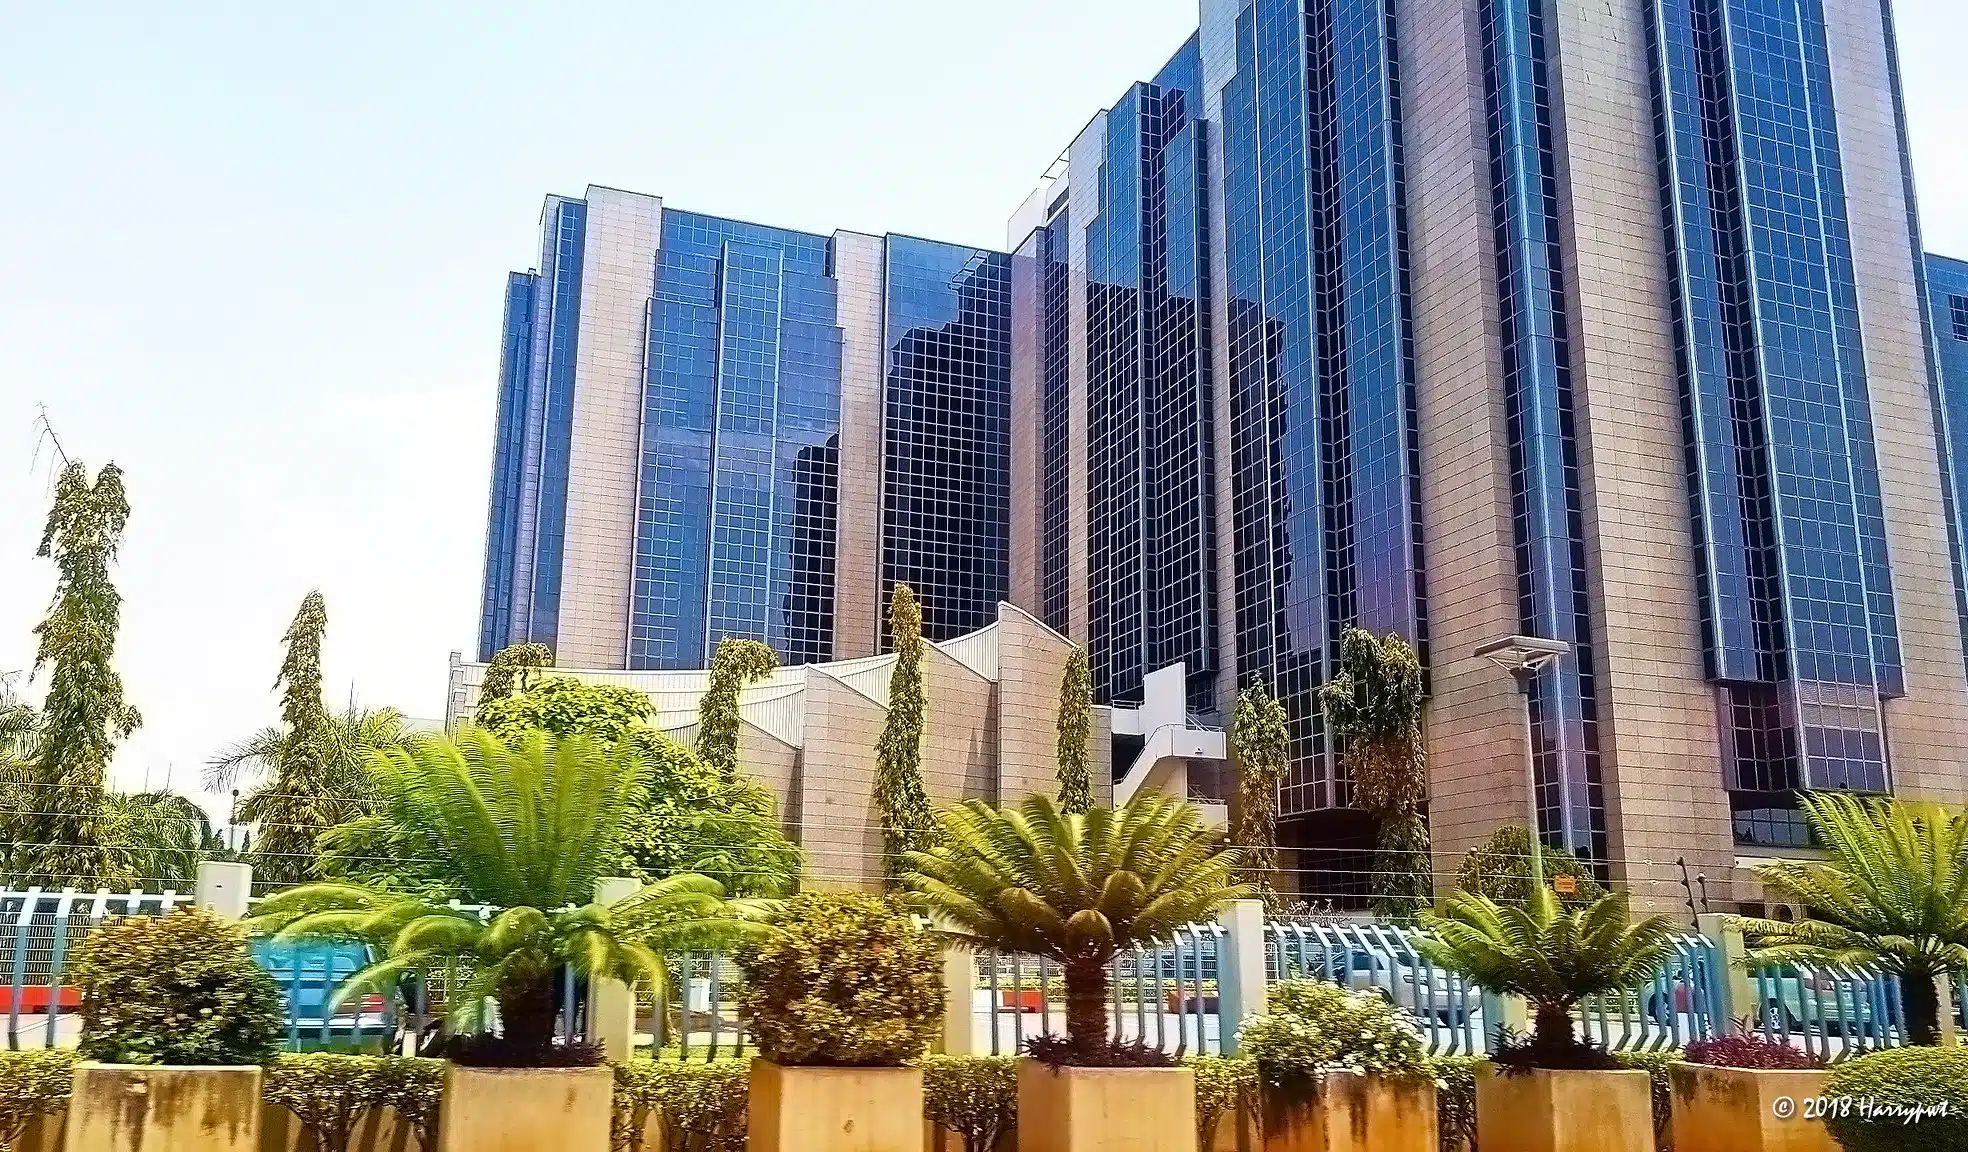
The distance becomes clearer with regional comparisons. Nigeria’s banking sector is a useful peer given the macro pressures it has weathered, and it reported an NPL ratio of 4.5% as of December 2024, well within the Central Bank of Nigeria’s own 5% prudential threshold.
Morocco, further north, sits at 8.6%. Kenya’s 15.6% is more than three times Nigeria’s current level, and roughly double the sub-Saharan Africa median that the IMF has recorded in recent years. Even accounting for Kenya’s particular mix of stresses, those gaps are hard to read as anything other than significant.
Why tier 2 and tier 3 banks deserve closer attention
Most reporting on Kenya’s NPL problem focuses on large, listed institutions because their data is public and granular. But the stress is more acute lower down the tier structure, and the implications are more existential.
Tier 2 and tier 3 banks face the same loan quality deterioration as their larger peers, but without the capital buffers, provisioning depth, or deposit franchise strength to absorb it as smoothly.
Amolo noted in January 2026 that while Kenya’s major banks have demonstrated resilience, “Tier 2 and Tier 3 banks continue to face liquidity challenges”, a concern that has yet to fully resolve.
The recapitalisation mandate makes this more urgent. Under the Business Laws (Amendment) Act 2024, the CBK raised the minimum core capital requirement for commercial banks from KSh1 billion ($7.73 million), unchanged since 2012, to KSh10 billion ($77.3 million), phased in over five years.
Banks must hold KSh3 billion ($23.2 million) by end of 2025, rising to full compliance by 2029. Twelve banks were below the initial threshold. HF Group, to cite one named example, raised KSh6 billion ($46.4 million) through a rights issue in December 2024 specifically to meet the requirement.
For smaller banks managing a deteriorating loan book, raising capital is expensive. External investors look at NPL ratios before committing. A bank trying to recapitalise while simultaneously managing credit stress faces a difficult, time-bound balancing act.
The deeper irony: Who banks are lending to instead
The NPL story matters beyond the banks themselves, because banks are the primary mechanism through which businesses and households access credit. When banks pull back, the cost is borne by borrowers.
The data already shows the shift. The market-weighted average investment in government securities by listed banks grew 30.2% in Q1 2025, compared to 3.1% the year before. Banks are lending to the government rather than to businesses. The government’s pending bills helped cause the credit problem, and now the financial system is channelling more capital back to that same government to earn safer returns.
With treasury bill yields dropping from 9-11% in 2025 to a 7-9% range as of early 2026, banks are under pressure to push capital back toward the private sector. That rotation is beginning, but slowly.
What comes next
Amolo expects a clearer improvement in 2026, with further gains in 2027. “From where I sit, we’ve seen quite a lot of activity in lending,” he noted, pointing to renewed borrower demand following rate cuts and the CBK’s new KESONIA credit pricing framework, which is designed to ensure that policy rate reductions are passed on to borrowers more quickly than before.
The structural case for improvement is real. Inflation has moderated to 4.4% as of March 2026. The shilling has stabilised.
But risks remain open. Government pending bills have not been fully cleared. Real estate and construction remain structurally exposed.
Kenya’s banking sector is not in crisis. Capital ratios are healthy, provisioning has improved, and the largest institutions have the capacity to absorb further stress. But “not in crisis” is not the same as “recovering cleanly.” The loan book problem took two years to build. It will take at least as long to fully unwind, and March 2026’s data suggests the unwind is not yet on a smooth trajectory.
N.B: Figures originally reported in Kenyan shilling and converted using the average exchange rate of KSh130/ $1 as of Tuesday, April 14, 2026.