Nigerian Stock Market Weekly Report
Perspective: Looking back from the week ending Friday, 3 October 2025, to frame the setup for this trading week (Oct 6–10, 2025).
The market has just served investors a neat reminder: breadth, rotation, and selective liquidity are a potent cocktail. In a four‑session trading week (Independence Day holiday), the NGX All‑Share Index (ASI) advanced +1.02% to 143,584.04, while market capitalization climbed +1.31% to ₦91.135 trillion. Under the hood, activity was anything but sleepy: 8.403 billion shares changed hands across 115,801 deals, though cash value compressed to ₦115.501 billion.
Here’s the tension we’re carrying into this second week of October: volume rose ~9.36% week‑on‑week (8.403b vs 7.684b), yet value fell ~76.6% (₦115.5b vs ₦494.1b). That’s a classic signature of rotation away from higher‑priced heavyweights toward lower‑priced, high‑turnover names. It wasn’t random churn either—Financials dominated the tape with 92.24% of total volume and 76.32% of value, while ICT and Consumer Goods provided targeted follow‑through.
Meanwhile, the leadership board sent a clear price-action signal: oil & gas, select financials, and quality consumer names found bids; engineering and construction, as well as pockets of insurance, took heat. With 53 advancers vs 43 decliners (51 unchanged), breadth improved materially from the prior week—enough momentum to make this week’s follow‑through a real possibility if flows persist.
For positioning into Oct 6–10, the story is simple: when volume climbs and breadth widens, the market is testing higher. The homework is to separate conviction buying from speculative turnover, and then lean into the setups with real sponsorship.
Read our stock market weekly outlook series here.
Key Market Metrics Dashboard (Last Week vs Prior Week)
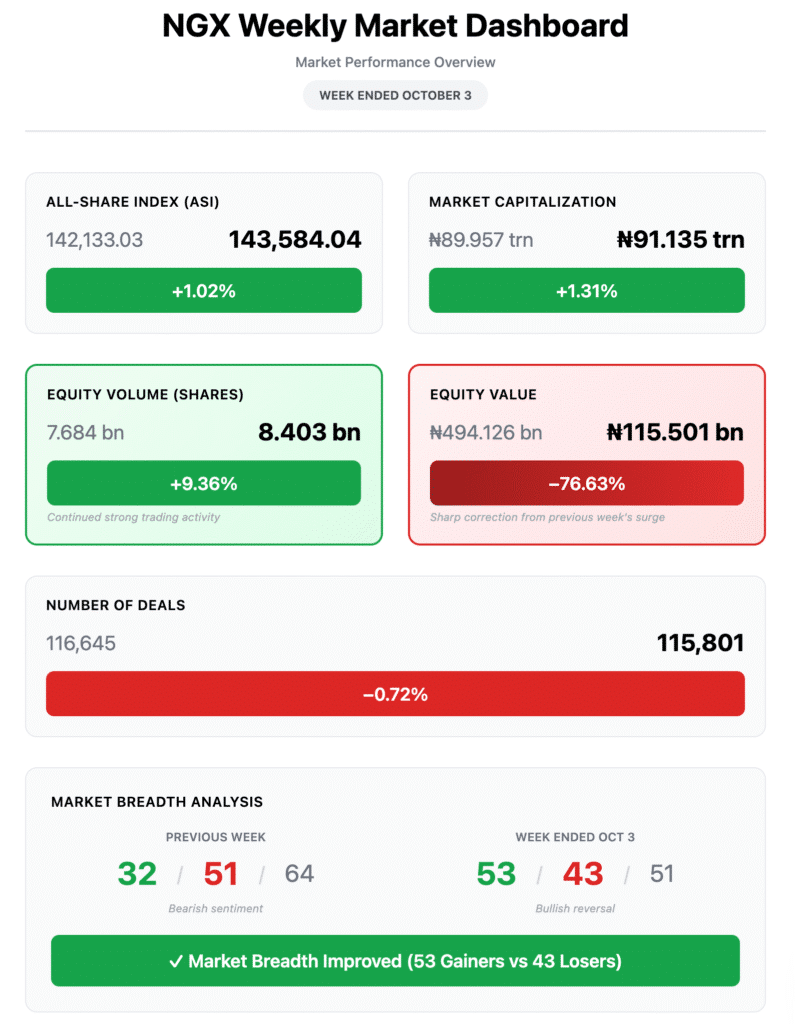
Market breadth: Net +10 (53–43) vs the prior week’s net −19 (32–51) — a decisive breadth swing.
What the Numbers Really Say (Narrative)
Here’s what really caught our attention going into this week:
- Volume up, value down: Rising share count alongside sharply lower naira turnover indicates migration into lower‑priced, high‑liquidity counters. This is often where short‑cycle alpha appears—but it also invites noise. Distinguish sustained institutional prints from one‑and‑done spikes.
- Financials as the engine: With 7.750 billion shares and ₦88.153 billion traded, the sector remains the central liquidity. That depth is the market’s transmission—sentiment here often bleeds into broader risk appetite.
- Sector dispersion: Oil & Gas (+5.68%) led, Industrial Goods (+1.66%) and Banking (+1.17%) supported, while Insurance (−2.02%) and Premium (−0.05%) lagged. That’s a pro‑cyclical tilt with a defensive pocket under pressure.
- Breadth flipped positive: From Monday’s soft advance/decline to Friday’s 39 advancers vs 25 decliners, demand broadened into week’s end—a constructive tell for Monday‑Tuesday follow‑through if volumes persist.
Bottom line for this week: The tape favors selective risk‑on. Smart money is positioning itself where turnover is credible (tier-1 banks, liquid oil & gas, and quality consumers), while traders are exploring momentum in cheaper names. Manage position sizing; let liquidity be your guide.
Winners & Losers — Price Action Map
Top 10 Gainers (Week Ended Oct 3)
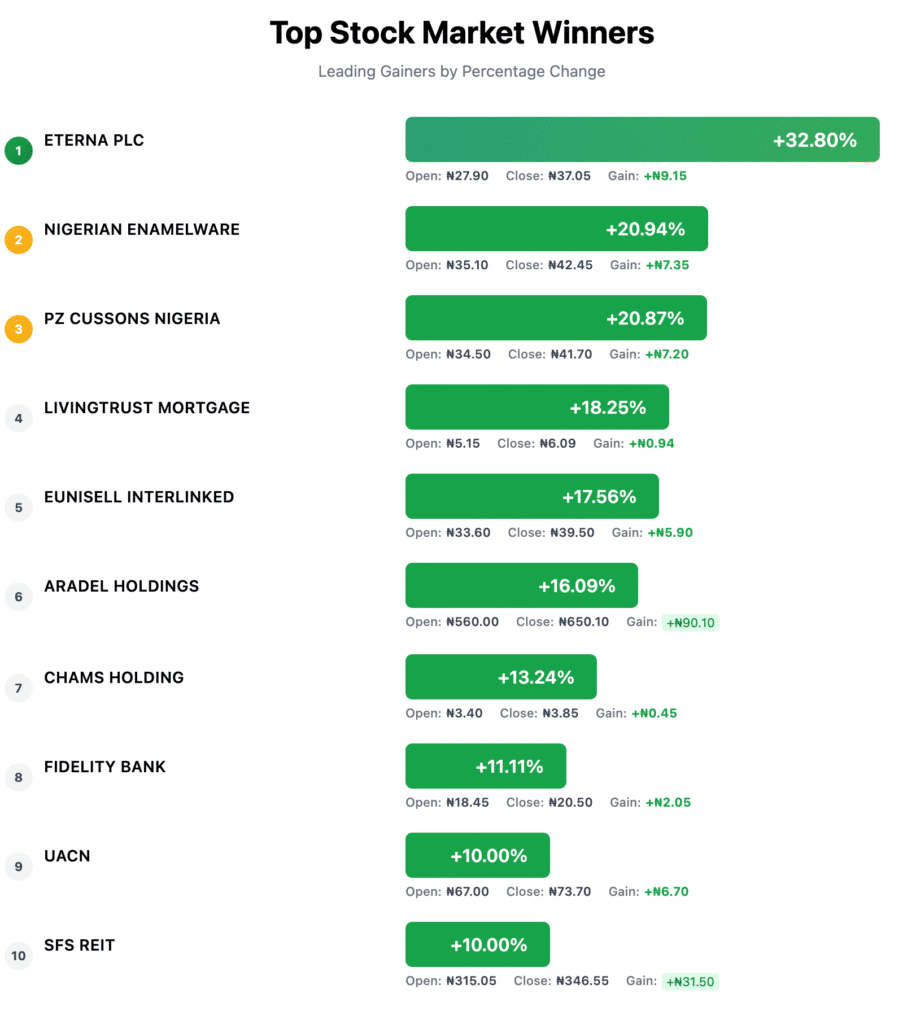
Read: Oil & Gas (Eterna, Aradel) and Consumers (PZ, Enamelware, UACN) shared the podium, with Fidelity representing banks among leaders—evidence of cross‑sector participation.
Top 10 Decliners
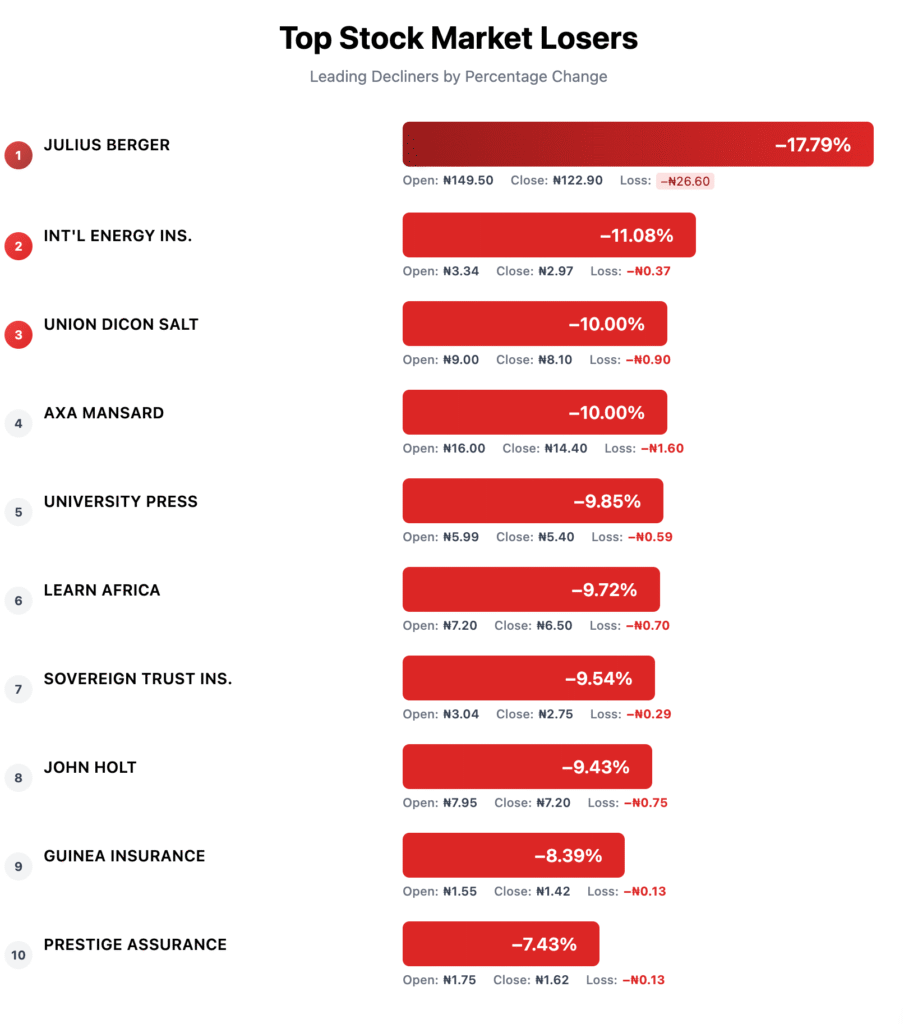
Read: Weakness clustered around Insurance and select Industrial/Services names. For contrarians, monitor stabilization in quality insurance franchises; for momentum traders, avoid catching falling knives until basing patterns emerge.
Sector Performance Deep Dive
- Financial Services: 7.750bn shares (92.24% of volume), ₦88.153bn (76.32% of value) across 54,074 deals. This remains the liquidity hub and the market’s risk barometer.
- ICT: 181.005m shares (~2.15% of volume), ₦4.077bn (~3.53% of value) in 9,364 deals — steady secondary flow.
- Consumer Goods: 126.554m shares (~1.51% of volume), ₦6.274bn (~5.43% of value) in 14,261 deals — supportive bid aligning with top‑gainer prints.
Index scoreboard (Week‑on‑Week):
- Leaders: Oil & Gas +5.68%, MERI Growth +1.29%, Industrial Goods +1.66%, Banking +1.17%, Lotus II +2.13%, Commodity +2.94%.
- Laggards/Flat: Insurance −2.02%, AFR Div Yield −2.78%, Premium −0.05%, ASeM 0.00%, Sovereign Bond 0.00%.
So what? The rotation skews pro‑cyclical (Oil & Gas, Industrials, Banks) while yield/defensive baskets cooled. For this week, watch whether Oil & Gas leadership persists and whether Banking can extend without overheating.
Volume & Value Lenses — Where Conviction Showed
- The top-three equities by volume were Cornerstone Insurance, Fidelity Bank, UBA, together 6.525bn shares and ₦52.699bn in 8,820 deals, accounting for 77.66% of volume and 45.63% of value.
- Translation: turnover concentration remains high; Fidelity/UBA are bellwethers for liquidity, while Cornerstone anchors the high‑beta trade. Sustained prints here often indicate the direction of the index for the week.
Daily texture (adv/dec):
- Mon (Sept 29): 25 / 36 — soft breadth
- Tue (Sept 30): 28 / 32 — improving
- Thu (Oct 2): 34 / 26 — breadth flips positive
- Fri (Oct 3): 39 / 25 — most substantial breadth of the week
Momentum accelerated into the close of the week, a constructive hand‑off into Oct 6–10 if liquidity doesn’t fade.
Daily Progression Snapshot
| Date | Deals | Volume | Value (₦) | Traded | Adv | Dec | Unchg |
| 29‑Sept‑25 | 28,088 | 383,909,693 | 11,606,251,165 | 125 | 25 | 36 | 64 |
| 30‑Sept‑25 | 27,982 | 1,240,473,112 | 29,816,107,171 | 128 | 28 | 32 | 68 |
| 02‑Oct‑25 | 32,677 | 6,233,443,665 | 54,451,364,168 | 130 | 34 | 26 | 70 |
| 03‑Oct‑25 | 27,054 | 544,741,361 | 19,626,941,192 | 128 | 39 | 25 | 64 |
Inflection: Thursday/Friday produced the strongest breadth — constructive carry‑over potential.
Corporate Actions, ETPs & Bonds — Flow Signals to Note
Supplementary Listing (Liquidity Event):
- Wema Bank Plc listed 14,143,244,747 additional shares (Rights Issue @ ₦10.45; 2‑for‑3). Total shares now 35,573,422,872. Liquidity events can compress near-term prices but improve float and participation; watch for post-listing equilibrium.
ETPs:
- 189,351 units, ₦17.284m in 272 deals (vs 154,584 units, ₦23.314m, 222 deals prior). Mixed flows; modest breadth of activity across equity/bond trackers and gold.
Bonds:
- 64,033 units, ₦77.665m in 13 deals (vs 75,196 units, ₦73.976m, 27 deals prior). Value increased slightly, with fewer prints; a selective appetite for sovereign/FGS and GBP-linked paper persisted.
What This Means for Your Investment Strategy (Actionable Playbook)
Context anchor (from last week’s NGX data): ASI +1.02% to 143,584.04; breadth improved to 53 advancers vs 43 decliners (from 32/51 prior week); volume up +9.36% to 8.403bn shares while value fell −76.63% to ₦115.50bn; Financials controlled 92.24% of volume and 76.32% of value; Oil & Gas +5.68%, Banking +1.17%, Industrial Goods +1.66%, Insurance −2.02%. Top three volume/value anchors: Cornerstone, Fidelity, UBA (combined 6.525bn shares, ₦52.70bn, 8,820 deals). Corporate action: Wema supplementary listing (rights issue) increased free float.
Conservative (capital‑preservation with dividends)
- Anchor in liquidity: Keep core allocations in tier‑1 banks and liquid consumer names that already featured as breadth and turnover beneficiaries. Use pullbacks into last week’s value area (especially Thursday–Friday’s ranges when breadth was strongest: 34/26 then 39/25) for incremental adds.
- Scale with breadth signals: Add only on days when advancers outnumber decliners (target ≥+10 net as a simple filter, e.g., Friday’s +14 net). Pause adds if breadth prints two consecutive negative days or if total deals drop materially below last week’s daily average (~28.9k deals over four sessions).
- Income posture: Within Financials, favor names with consistent deal counts and sustained value prints (sector carried ₦88.15 billion last week). In Consumer Goods (₦6.27bn value), prioritize counters that participated in the week’s late‑week advance.
- Defensive rotation triggers: If Oil & Gas leadership fades (after +5.68% WoW) and Insurance continues to lag (−2.02%), tilt back toward Main Board/Pension baskets that rose +1.57%/+1.26%, respectively.
Growth‑oriented (momentum with risk controls)
- Ride sector leadership with guardrails: Lean into Oil & Gas and Industrial Goods continuation as long as daily closes hold above the prior week’s mid‑range and volume remains elevated versus Monday–Tuesday baselines. Last week’s leaders on price: Eterna (+32.80%), Aradel (+16.09%), PZ (+20.87%), Enamelware (+20.94%).
- Liquidity confirmation: Prefer breakouts that coincide with rising deal counts and expanding value on the day. Given market-wide value compression (₦115.5bn vs ₦494.1bn prior), treat failed expansions as exit signals.
- High-turnover setups: In Financials/ICT, look for back-to-back high-volume closes above VWAP to validate continuation. Use Thursday (Oct 2)—the highest‑volume day (6.23bn shares; ₦54.45bn)—as a reference for what “real sponsorship” should resemble.
- Stop discipline: Trail stops below the prior week’s mid‑range of the individual counter or the Thursday session low if the name printed its surge that day. Rotate capital quickly if leadership baton passes to Banks/Industrials.
Value hunters (mean‑reversion & special situations)
- Insurance triage: With the sector −2.02% WoW and multiple decliners (e.g., INTENINS −11.08%, STI −9.54%, GUINEA −8.39%), build a watchlist of fundamentally stronger insurers. Entries only after: (1) two higher lows on rising volume, and (2) sector index stabilizes for ≥2 sessions.
- Rights Issue Aftermath (Wema): Supplementary Listing of 14.14 Billion Shares Expands Float to 35.57 Billion. Expect near‑term price discovery; exploit dislocations where volume normalizes but price lags peers with similar liquidity. Let post‑listing book‑build dictate sizing.
- Event-driven pairs: Where oil and gas leaders extended (e.g., Eterna, Aradel), monitor relative-value fades into late week; partial hedges via Banking/Industrial strength (both positive Year-over-Year) can reduce idiosyncratic risk without abandoning cyclical exposure.
Risk management heuristics
- Size by liquidity: Calibrate position size to each name’s average daily value traded relative to the market’s compressed value backdrop. Avoid outsizing in counters that contributed little to last week’s ₦115.5bn aggregate.
- Respect the baton: If Oil & Gas cools and Banks/Consumers carry the bid (Banking +1.17%, Consumer Goods +0.13%), rotate, don’t dig in.
- Tape overrides thesis: If breadth flips negative for two straight sessions and total daily value fails to exceed ₦25–30bn, de‑risk and wait for confirmation.
Disclaimer: This is not investment advice; please do your due diligence.
Forward‑Looking Map — What to Watch (Oct 6–10)
1) Breadth & momentum
- Validation: Look for two consecutive strong‑breadth days (advancers > decliners by ≥10) to confirm the Friday hand‑off (39/25).
- Warning: A swift reversion to sub‑par breadth (e.g., below 28/32) coupled with shrinking deals toward ≤27k/day would argue for patience.
2) Liquidity concentration (leadership tells)
- Bellwethers: Track Fidelity, UBA, Cornerstone—they accounted for 77.66% of last week’s volume and 45.63% of value. If their turnover persists or broadens to other tier-1 banks, risk appetite remains intact; if participation narrows to only one name, expect choppy conditions.
3) Sector baton
- Continuation case: Oil & Gas holds above last week’s value area after +5.68% WoW, while Industrials/Banking maintain +1–2% type strides.
- Rotation case: Oil & Gas pauses orderly while Main Board (+1.57%) and Pension (+1.26%) constituents extend—still constructive for the index.
- Stress case: Insurance remains weak, and Banking stalls; expect the index to stall near the 143.5k–144k area with intraday fade risk.
4) Value vs. growth tilt
- Markers: MERI Growth +1.29% vs AFR Div Yield −2.78% last week. Sustained preference for growth/cyclicals implies buy‑the‑dip in leaders; a reversal (Div Yield outperforming) favors income baskets and higher‑dividend banks.
5) Corporate‑action aftershocks
- Wema rights issue listing: Watch for stabilization of intraday spreads and normalization of deal count. Healthy absorption would be indicated by a rising value traded without outsized volatility.
6) Daily tape references
- Support context: Prior week’s close 143,584.04 with support context near the 142k handle (previous close region).
- Momentum tells: Replicating Thursday’s high‑energy profile (6.23bn shares; ₦54.45bn; 34/26 breadth) early in the week would signal institutional sponsorship.
- Inflection calendar: A firm Monday with follow-through on Tuesday typically invites mid-week trend extension; a soft Monday with weak breadth cues indicates tighter risk and selective buying only after afternoon strength.
Checklist for the week:
- Adv/Dec ≥ +10 net for two sessions
- Total daily value ≥ ₦30–40bn at least once by mid‑week
- Leadership confirmed in at least two of: Oil & Gas / Banking / Industrials.
- Turnover in bellwethers broadens beyond the top three volume names.
- Breadth follow‑through: Does the 39/25 (adv/dec) from Friday repeat early‑week? Two consecutive strong‑breadth days would validate higher probes in ASI.
- Liquidity concentration: Do Fidelity/UBA/Cornerstone remain turnover anchors? If they hold leadership, risk appetite remains intact; if not, expect choppy waters.
- Sector baton: Oil & Gas led (+5.68%). Watch for continuation vs fade. An orderly pause with rotation into Industrials/Banking would still be constructive.
- Value vs growth tilt: MERI Growth rose +1.29% but AFR Div Yield fell −2.78%. Monitor whether the market continues to favor cyclical/quality growth over yield baskets.
Key reference levels & context:
- ASI: Closed 143,584.04; last week’s up‑move occurred with improved breadth. Support context sits near the prior close region (142k handle). A strong open above last Friday’s value area would embolden dip‑buyers.
- Pivotal days: If Monday is firm and Tuesday confirms, expect traders to press winners into mid-week. A soft Monday with weak breadth argues for patience and tighter risk management.
Appendix — Index Summary (WoW %)
- ASI +1.02% | Main Board +1.57% | NGX30 +1.07% | CG +0.97% | Banking +1.17% | Pension +1.26% | Insurance −2.02% | AFR Div Yield −2.78% | MERI Growth +1.29% | MERI Value −0.81% | Consumer Goods +0.13% | Oil & Gas +5.68% | Industrial Goods +1.66% | Lotus II +2.13% | Growth +3.59% | Sov. Bond 0.00% | Pension Broad +1.14% | Commodity +2.94%
All figures and tables are drawn exclusively from the NGX Weekly Market Report for the week ended Friday, 3 October 2025.
Please note that this analysis reflects market observations and institutional patterns, rather than personalized investment advice. Always conduct your due diligence and consider your risk tolerance before making investment decisions.