
Discussions about Nigeria’s declining GDP per capita have been gaining attention lately, particularly following recent comments from Dr. Akinwumi Adesina, President of the African Development Bank.
In February, the International Monetary Fund (IMF) reported that Nigeria’s GDP per capita decreased from $877 (≈N1.34million) in 2024 to $835 (≈N1.1.27million) in 2025.
GDP per capita is one of the key parameters used to measure the average income and standard of living in a country. When it drops, it often means that economic growth isn’t keeping up with population growth.
In this article, we break down Nigeria’s GDP per capita trend from 1960 to 2025, using reliable data from the International Monetary Fund (IMF), to help you understand how the economy has really performed over the years.
What is GDP per capita, and how is it relevant?
Nigeria’s GDP per capita refers to the country’s Gross Domestic Product divided by its total population.
It shows the average economic output per person and is commonly used to measure the standard of living and financial well-being of a country’s citizens.
GDP itself represents the total value of goods and services produced within Nigeria in a given year. When this figure is divided by the population, it helps us understand how much, on average, each person contributes to or benefits from the economy.
- For example, IF Nigeria’s GDP is $400 billion and the population is 200 million, the GDP per capita would be $2,000.
This metric is relevant because it allows for easy comparison between Nigeria and other countries or across different years.
A rising GDP per capita suggests economic growth and improved living conditions, while a decline may indicate poverty, unemployment, or inflation issues.
NOTE:
- GDP per capita doesn’t reflect income distribution. A high GDP per capita could still mask extreme inequality where a small group holds most of the wealth.
Nigeria’s GDP per capita trend from 1960 to 2025
According to data harvested from the IMF database, here is a track record of how Nigeria’s GDP per capita has performed in the last 64 years:
| Date | GDP per capita | Annual Growth |
| 1960 | $93 (N142,180) | |
| 1961 | $97 (N148,295) | 4.3% |
| 1962 | $105 (N160,526) | 7.6% |
| 1963 | $108 (N165,112) | 3.0% |
| 1964 | $113 (N172,756) | 5.2% |
| 1965 | $117 (N178,871) | 3.5% |
| 1966 | $124 (N189,573) | 6.0% |
| 1967 | $100 (N152,882) | -20.0% |
| 1968 | $97 (N148,295) | -2.2% |
| 1969 | $121 (N184,987) | 24.8% |
| 1970 | $224 (N342,455) | 84.8% |
| 1971 | $160 (N244,611) | -28.5% |
| 1972 | $209 (N319,523) | 30.5% |
| 1973 | $252 (N385,262) | 20.5% |
| 1974 | $403 (N616,114) | 59.6% |
| 1975 | $438 (N669,623) | 8.8% |
| 1976 | $556 (N850,023) | 27.0% |
| 1977 | $536 (N819,447) | -3.7% |
| 1978 | $527 (N805,688) | -1.7% |
| 1979 | $661 (N1,010,500) | 25.5% |
| 1980 | $911 (N1,392,755) | 37.8% |
| 1981 | $911 (N1,392,755) | 0% |
| 1982 | $768 (N1,174,133) | -15.8% |
| 1983 | $506 (N773,582) | -34.1% |
| 1984 | $357 (N545,788) | -29.4% |
| 1985 | $341 (N521,327) | -4.6% |
| 1986 | $262 (N400,550) | -23.0% |
| 1987 | $272 (N415,839) | 3.5% |
| 1988 | $293 (N447,944) | 7.8% |
| 1989 | $275 (N420,425) | -6.2% |
| 1990 | $653 (N998,319) | 137.7% |
| 1991 | $616 (N941,753) | -5.7% |
| 1992 | $522 (N798, 044) | -15.2% |
| 1993 | $553 (N845,437) | 6.0% |
| 1994 | $761 (N1,163,432) | 37.6% |
| 1995 | $1,225 (N1,872,804) | 61.0% |
| 1996 | $1,560 (N2,384,959) | 27.4% |
| 1997 | $1,656 (N2,531,725) | 6.1% |
| 1998 | $1,803 (N2,756,462) | 8.9% |
| 1999 | $482 (N736,891) | -73.3% |
| 2000 | $555 (N848,495) | 15.1% |
| 2001 | $583 (N891,302) | 5.2% |
| 2002 | $731 (N1,117,567) | 25.3% |
| 2003 | $780 (N1,192,479) | 6.8% |
| 2004 | $963 (N1,472,253) | 23.4% |
| 2005 | $1,222 (N1,868,218) | 26.8% |
| 2006 | $1,563 (N2,389,545) | 27.9% |
| 2007 | $1,820 (N2,782,452) | 16.4% |
| 2008 | $2,232 (N3,412,326) | 22.6% |
| 2009 | $1,960 (N2,996,487) | 12.2% |
| 2010 | $2,360 (N3,608,015) | 20.4% |
| 2011 | $2,579 (N3,942,826) | 9.3% |
| 2012 | $2,794 (N4,271,523) | 8.3% |
| 2013 | $2,882 (N4,406,059) | 3.2% |
| 2014 | $3,099 (N4,737,813) | 7.5% |
| 2015 | $2,592 (N3,962,701) | -16.3% |
| 2016 | $2,072 (N3,167,715) | 20.1% |
| 2017 | $1,876 (2,868,066) | -9.5% |
| 2018 | $2,058 (N3,146,311) | 9.7% |
| 2019 | $2,265 (N3,462,777) | 10.1% |
| 2020 | $2,020 (N3,088,216) | -10.8% |
| 2021 | $2,018 (N3,085,158) | -0.1% |
| 2022 | $2,135 (N3,264,030) | 5.8% |
| 2023 | $1,597 (N2,441,525) | -25.2% |
| 2024 | $877 (N1,340,775) | -45.08% |
| 2025 | $835 (1,276,564) | 4.79% |
While 2014 witnessed the highest GDP per capita in Nigeria’s history, the decline in 2024 is hard to ignore, from $1,567 (N2,441,525) to $877 (N1,340,775).
Meanwhile, Nigeria is yet to release its real Gross Domestic Product (GDP) data for the first quarter of 2025, a month after the scheduled publication, raising fresh concerns about data governance, institutional capacity, and investor confidence.
What’s causing the drop in Nigeria’s GDP per capita?
These challenges aren’t new, but their impact is becoming harder to ignore:
- Political Instability: Uncertainty in government policies, frequent changes in leadership direction, and issues such as insecurity can deter both local and foreign investment. Investors need a stable environment to commit long-term funds.
- Logistics Bottlenecks: From congested ports to delays in transporting goods, inefficient logistics systems hinder businesses’ growth and prevent local producers from reaching larger markets.
- Poor Infrastructure: This increases the cost of doing business and slows down productivity across all sectors.
Experts argue that the driving factors extend beyond these and are multilayered.
Comparing Nigeria’s GDP per capita with other african countries
Despite being among the top 4 economies by size, Nigeria ranks low in GDP per capita, revealing a disconnect between total wealth and individual prosperity. The performance of African countries in 2024 paints a clearer picture:
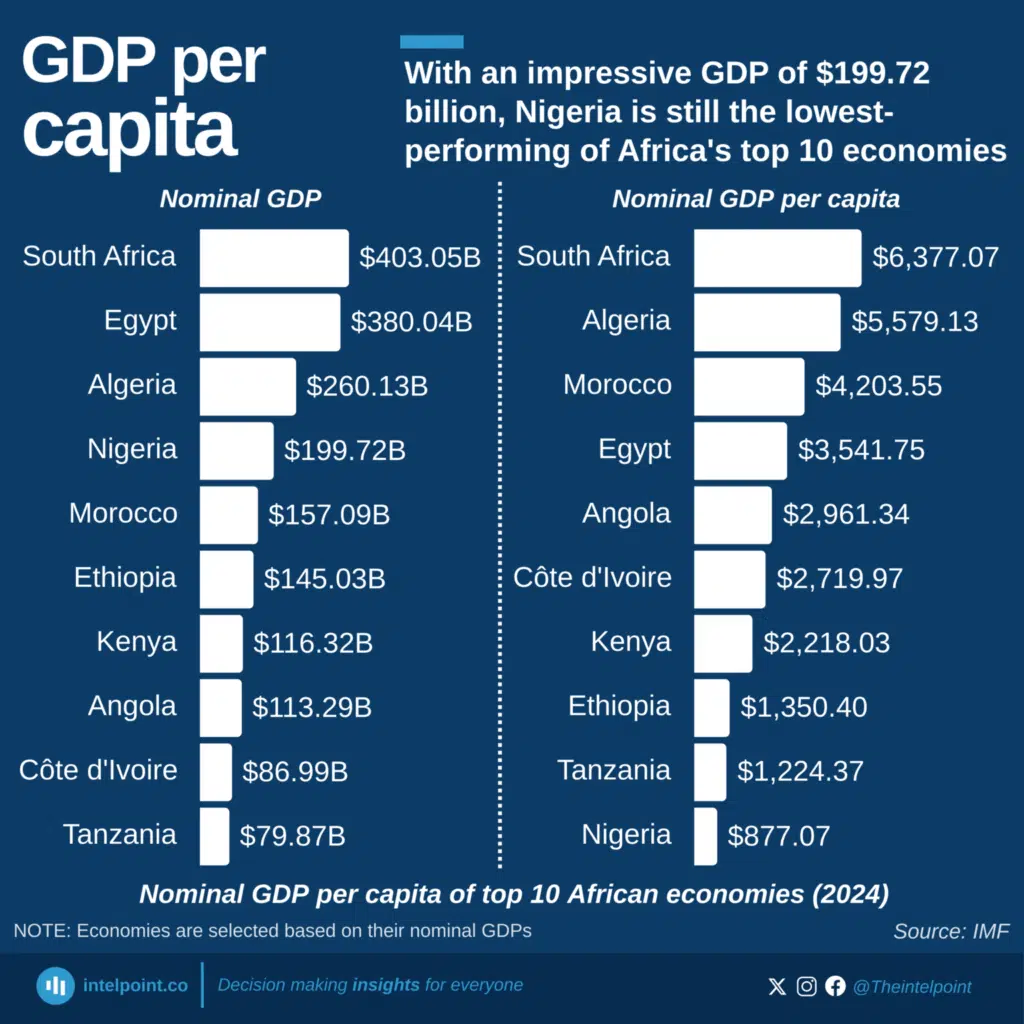
With the highest nominal GDP and the highest per capita GDP, South Africa has showcased balanced growth and improved wealth distribution.
Countries like Ethiopia and Nigeria have large populations, which dilute their GDP and lower their per capita figures.
What this trend means for nigerians
When GDP per capita drops, it means that people are earning less or that the economy isn’t growing fast enough to match the rising population. For everyday Nigerians, this can translate to tighter budgets, fewer job opportunities, and a higher cost of living.
Lower income levels often result in reduced spending, and when people aren’t buying, businesses struggle. That can slow down investment, expansion, and even job creation.
It also pushes many skilled Nigerians (doctors, engineers, creatives) to look for greener pastures abroad.
This brain drain means the country not only loses talent but also the potential to drive local growth and innovation.
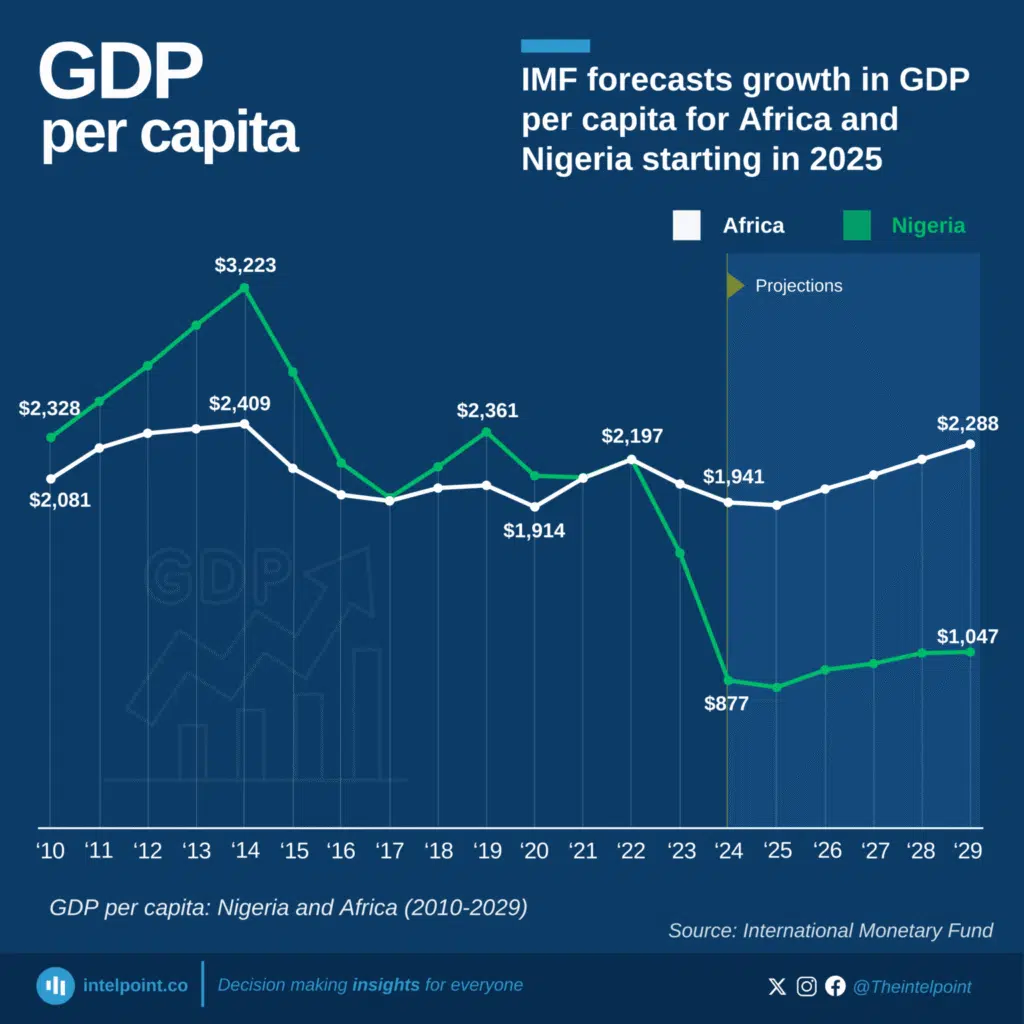
Nigeria GDP per capita forecast
According to the IMF, GDP per capita in Nigeria and Africa is projected to increase from 2025 after years of stagnation and decline.
More on Intelpoint
Encouragingly, growth is expected with projections of $1,047 (N1,600,674) for Nigeria by 2029, signalling a slow but steady improvement in living standards.
Despite this projection, experts continue to warn that Nigeria remains at risk of stagnation unless the long-standing issues of electrification, infrastructure, and logistics bottlenecks are adequately addressed.
Note: Exchange rate used in this article is N1,528.82/$1 on July 16, 2025