Nigerian Stock Market Weekly Report
Perspective: the new trading week starting Monday, 15 September 2025
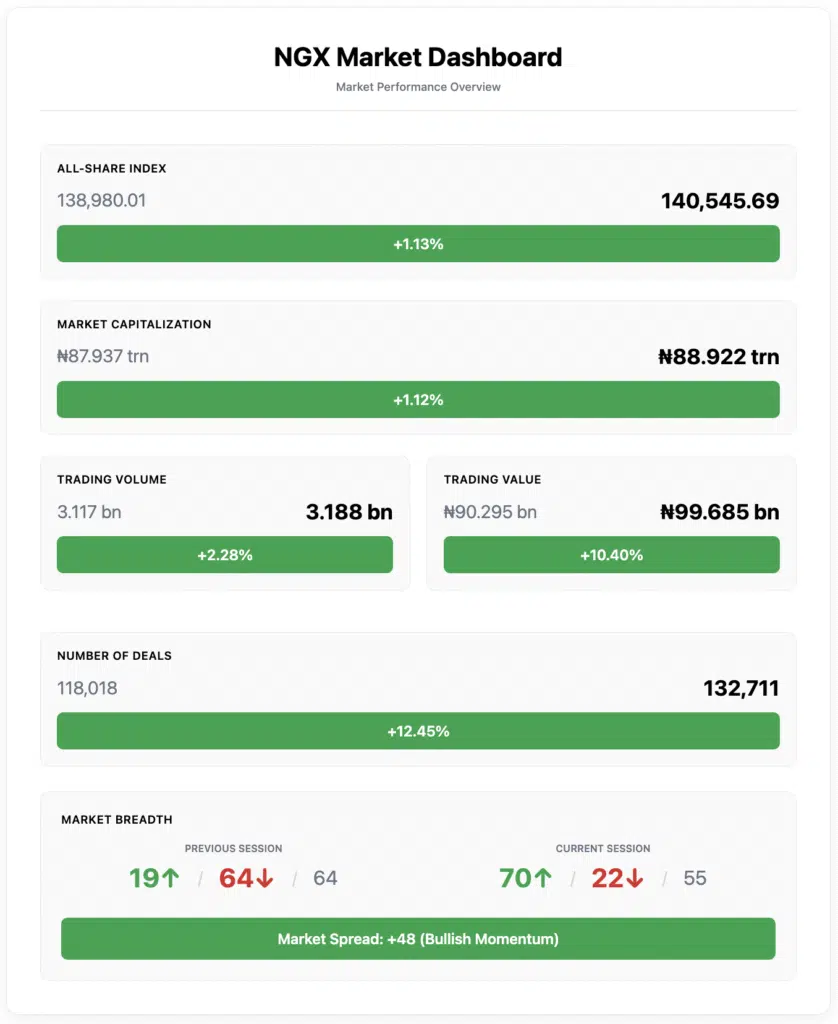
Last week felt like a market that finally found its rhythm. The NGX All-Share Index (ASI) added roughly one and a quarter percent to close at 140,545.69, while total equity capitalization finished at ₦88.922 trillion—both up by about 1.12% on the week. That’s not just a green candle; it’s a vote of confidence from broad parts of the market.
Under the hood, turnover ticked higher: 3.188 billion shares changed hands (vs 3.117 billion the prior week), with ₦99.685 billion in value (vs ₦90.295 billion), across 132,711 deals (vs 118,018). The tape showed rising participation and bigger tickets—healthy conditions as we head into this new week.
Breadth flipped decisively positive. 70 gainers overwhelmed 22 decliners (with 55 unchanged), a dramatic improvement versus the previous week (only 19 gainers, 64 decliners, 64 unchanged). This isn’t a narrow rally—it’s the market broadening out.
Two more tells: Wednesday (Sep 10) printed the week’s value spike at ₦40.64 billion, and Thursday delivered the strongest breadth (41 advancers vs 12 decliners). Momentum plus participation—that’s the cocktail you want to see carried into the week of Sep 15.
Read our series of Nigerian stock market weekly reports here.
Headline numbers:
- ASI: 138,980.01 → 140,545.69 (+1.13%)
- Market Cap: ~₦87.937trn → ₦88.922trn (+1.12%)
- Volume: 3.117bn → 3.188bn (+2.28%)
- Value: ₦90.295bn → ₦99.685bn (+10.40%)
- Deals: 118,018 → 132,711 (+12.45%)
- Breadth: Prev 19↑ / 64↓ / 64—> 70↑ / 22↓ / 55
Key Market Metrics Dashboard
*Market cap previous derived from +1.12% WoW to ₦88.922trn: 88.922 / 1.0112 ≈ ₦87.937trn.
Market breadth: Clear positive skew as advancers outnumber decliners by more than 3:1.
Market Analysis Narrative (What the Numbers Mean)
Breadth is back. The shift from 19/64 to 70/22 is the most important single change: rallies built on broad participation tend to be more durable. That breadth was confirmed by turnover: volume rose modestly while value jumped double‑digits WoW, signaling larger ticket sizes and probable institutional involvement.
Sector flow was nuanced. Financial Services accounted for 71.59% of total volume (2.282bn shares) but only 38.94% of value (₦38.812bn). Meanwhile, Oil & Gas traded 186.744 million shares but racked up ₦35.173 billion in value—fewer shares, larger average ticket sizes. Consumer Goods sat in between (198.393m shares; ₦12.836bn). The value mix implies that while banks dominated the tape in terms of prints, the high-conviction cheques leaned into Energy and selective Consumer Sectors.
Style & sector leadership broadened. Week-on-week, multiple indices printed green: NGX Growth (+10.25%), MERI Value (+3.65%), AFR Bank Value (+2.81%), Insurance (+2.45%), Oil/Gas (+2.38%), Lotus II (+2.58%) alongside the broad ASI (+1.13%). This wasn’t a single-factor rally; both growth and value factors participated, thereby improving cross-market resiliency.
Liquidity anchors were constructive. FCMB Group, Access Holdings, and Universal Insurance collectively traded 1.249bn shares (≈39.17% of the week’s total) and ₦14.277bn in value across 10,359 deals—providing dependable intraday liquidity and a barometer for risk appetite.
Daily cadence reinforced the story. The mid‑week value surge (₦40.64bn on Wed) and the strongest breadth (Thu) framed a market accumulating on strength rather than just short‑covering. That pattern often leads to follow‑through attempts early the following week.
Winners & Losers Analysis
Top 10 Gainers (Week)
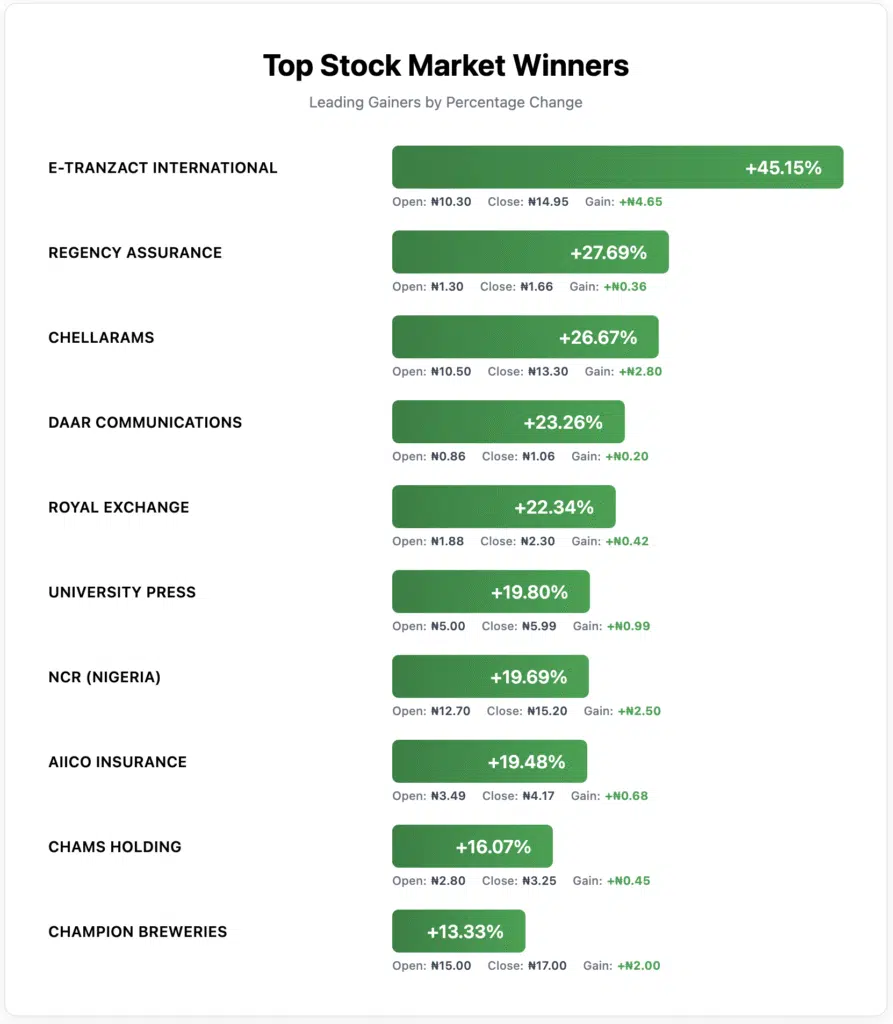
Read‑through: Insurance showed dispersion but also leadership (Regency, AIICO, Royal Exchange). Payments/fintech (e‑Tranzact) and selected Consumer (Champion Breweries) joined the party—evidence of breadth across sub‑sectors.
Return example: Owning e‑Tranzact for the week delivered +45.15%; AIICO Insurance returned +19.48% in five sessions.
Top 10 Decliners (Week)
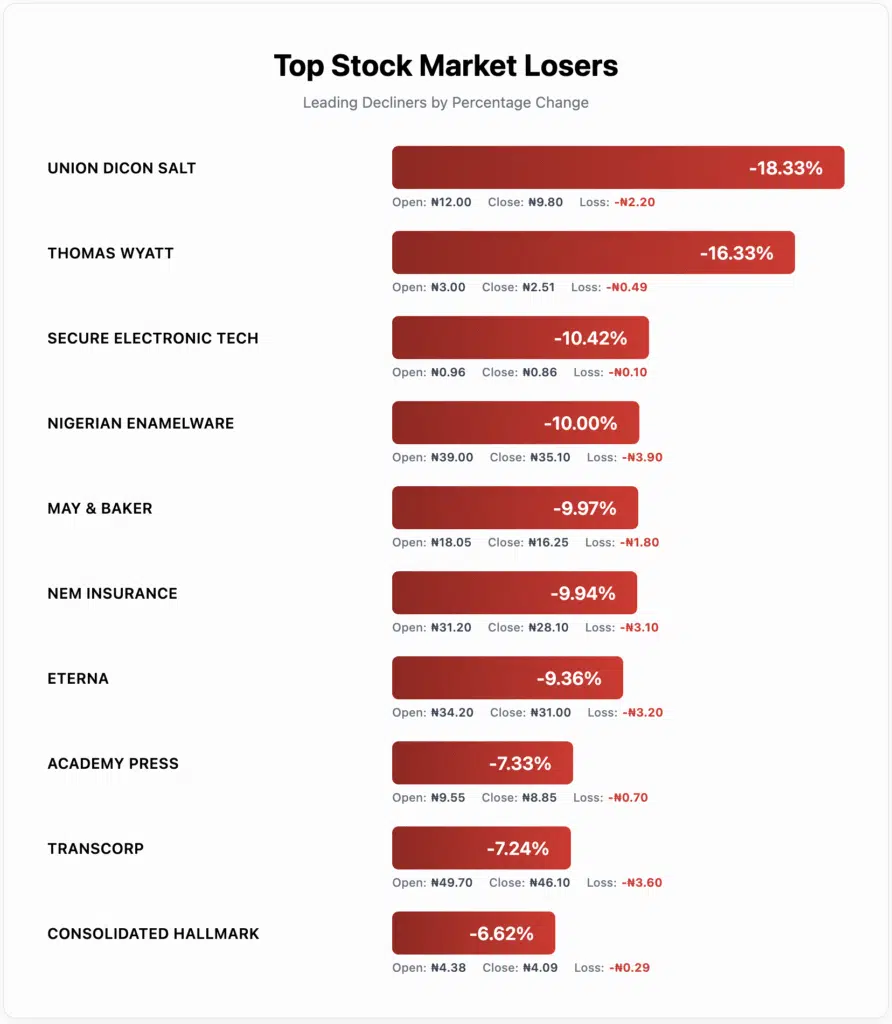
Read‑through: Pullbacks stretched across Industrials, Healthcare, Insurance, Energy, and Publishing—classic profit‑taking after prior strength. Insurance appears on both lists; stock-specific filters (valuation, catalysts, liquidity) are also important.
Sector Performance Deep Dive
Activity by Sector (selected):
- Financial Services: 2.282bn shares (71.59% of weekly volume) → ₦38.812bn (38.94% of value). Interpretation: high print count, lower average ticket vs Energy.
- Oil & Gas: 186.744m shares → ₦35.173bn value. Interpretation: fewer shares / higher tickets; indicative of concentrated conviction.
- Consumer Goods: 198.393m shares → ₦12.836bn value. Interpretation: selective accumulation; watch follow‑through.
Index Moves (WoW):
- NGX Growth: +10.25%
- NGX MERI Value: +3.65%
- NGX AFR Bank Value: +2.81%
- NGX Insurance: +2.45%
- NGX Oil/Gas: +2.38%
- NGX Lotus II: +2.58%
- NGX ASI (broad market): +1.13%
Why it matters: Leadership wasn’t single‑threaded. The mix of growth and value factor gains, with Energy showing large-ticket flows, suggests that smart-money rotation is active rather than passive beta drift.
Volume & Value Analysis
- Most Active by Volume: FCMB Group, Access Holdings, and Universal Insurance combined for 1.249 billion shares (≈39.17% of total volume), with a value of ₦14.277 billion in 10,359 deals. These names acted as liquidity anchors and sentiment gauges.
- Value Spike Day: Wednesday (10 Sep) printed ₦40.64bn in value on 767.7m shares—larger average tickets and probable block trades.
- Breadth Peak: Thursday (11 Sep): 41 advancers vs 12 decliners—momentum confirmation.
Investor psychology: Rising value outpacing volume often signals conviction buying rather than mere churn. The breadth surge indicates participation widened beyond a few leaders, improving rally quality.
Daily Market Progression (8–12 Sep 2025)
| Day | Deals | Volume (shares) | Value (₦) | Adv | Dec | Unch |
| Mon 08‑Sep | 36,006 | 947,835,969 | 17,969,856,801.57 | 41 | 18 | 69 |
| Tue 09‑Sep | 25,320 | 659,163,979 | 12,504,983,206.67 | 36 | 19 | 72 |
| Wed 10‑Sep | 24,800 | 767,687,944 | 40,640,026,999.81 | 38 | 27 | 62 |
| Thu 11‑Sep | 22,896 | 378,157,095 | 12,406,718,970.40 | 41 | 12 | 74 |
| Fri 12‑Sep | 23,689 | 434,708,854 | 16,163,654,159.42 | 32 | 21 | 71 |
Inflection points: Wednesday’s value burst and Thursday’s breadth surge frame the week’s constructive bias.
Corporate Actions & Market Events
- Price Adjustment (Ex-Dividend): Sovereign Trust Insurance (STIPLC) went ex-dividend on September 8, 2025. Last close ₦2.97; dividend ₦0.05; implied ex‑div ₦2.92.
- Suspension Lifted: Trading suspension on Regency Alliance Insurance lifted on Tue, 09 Sep 2025, following submission of required financials under the Default Filing Rules.
- Exchange‑Traded Products (ETPs): 186,061 units traded, value ₦20.616 million, across 369 deals. Most extensive line by value: LOTUSHAL15 (113,968 units; ₦6.39 million).
- Bonds (Fixed Income on NGX): 24,228 units traded, value ₦22.236 million, across 34 deals; notable line included FGSUK2033S6 (6,724 units; ₦6.83 million).
What This Means for Your Investment Strategy (Actionable Guidance)
Conservative Investors
Prioritize liquidity and breadth alignment. Maintain core exposure to broad market proxies and high‑liquidity names that consistently anchor weekly turnover (e.g., the major financials and widely held insurers reflected in activity). The breadth surge (70↑/22↓) argues against de‑risking too early. Use minor dips toward last week’s base (ASI ~138,980) to rebalance rather than rotate aggressively.
Growth‑Oriented Investors
Lean into where value concentration is highest and factor momentum is strongest. The NGX Growth index’s +10.25% pop, alongside Oil & Gas printing high value on relatively light share count, suggest select names are drawing larger cheques.
Tactically, add on strength following breadth confirmation days (like Thu), and trail stops under prior day lows to manage volatility. Watch for follow-through early in the week; if the value stays elevated with stable breadth (greater than 2:1), add increments rather than chasing gaps.
Value Hunters
The losers’ board is your screening ground. Industrials (Nigerian Enamelware), Healthcare (May & Baker), Insurance (NEM), Energy (Eterna), and Conglomerates (Transcorp) all retraced. Separate mean‑reversion candidates from fundamental fades using: (i) three‑day relative strength vs sector index, (ii) liquidity profile (deals count), and (iii) presence/absence of corporate action noise (e.g., ex‑div effects). Build staggered entries rather than single‑price punts.
Risk Management & Positioning Notes
- Ticket‑size tell: Value up +10.40% vs volume +2.28% → larger average trade sizes; supports the case for disciplined adds on strength.
- Breadth quality: From 19/64 to 70/22 is more than a blip; it argues for staying with winners until breadth decisively weakens.
- Cross‑asset gauge: ETP and bonds traded modest sums but with steady deal counts—no clear flight‑to‑safety signal within the week’s prints.
Disclaimer: This is not investment advice; please conduct your own due diligence.
Forward‑Looking Analysis (Week of 15 Sep 2025)
Key Levels:
- Resistance-to-beat / Momentum marker: ASI 140,545.69 (last close). Holding above and building value would confirm trend intent.
- Immediate support / Prior base: ASI 138,980.01. A retest that holds with firm breadth (>2:1) would be constructive.
Catalyst Watch (Market Micro‑Signals):
- Breadth persistence: Can the market sustain breadth near 3:1 (last week’s 70:22)? Early‑week breadth >2:1 would validate institutional follow‑through.
- Value‑mix rotation: Financials dominated volume, not value. If Oil & Gas/Consumer continue to punch above their weight in value, leadership could rotate beyond banks. Track daily sector value shares for tells.
- Corporate action ripples: With Regency Alliance’s suspension lifted and ex‑div adjustments (e.g., Sovereign Trust Insurance), expect idiosyncratic sub‑sector moves; watch the insurance tape for dispersion.
Game Plan for the Desk:
- Start the week with a net long bias while breadth remains above 2:1 and daily value remains elevated compared to last week’s Monday and Tuesday baselines.
- Scale into strength on follow‑through days; trim into vertical moves when breadth narrows and value fades.
- Keep a dip‑buy list from the Losers table, pre‑sized with risk limits; use Wednesday’s value burst as a benchmark for “real buying” days.
Please note that this analysis reflects market observations and institutional patterns, rather than personalized investment advice. Always conduct your due diligence and consider your risk tolerance before making investment decisions.