The United States’ Trump administration has unveiled sweeping new tariffs to nearly every country in the world. These “reciprocal tariffs” have targeted dozens of African countries, with the claim that these nations have been charging the U.S high duties for years.
Per the Trump administration, Lesotho, Madagascar, Botswana and Mauritius have been charging the US up to 99%, 95% and 80% in tariffs. In response, the U.S. is now imposing steep tariffs of its own—up to 50% —on African exports under what it’s calling a “Liberation Day” trade reset.
The administration’s approach was to look at what a country’s tariff to the US was, and reply with half of that. For instance, if a country charges the US 99% tariffs, the administration reciprocates with 50%.
This approach threatens initiatives like the Africa Growth and Opportunity Act (AGOA)—a deal that guarantees duty-free exports from Sub-Saharan Africa to the U.S.—especially if “reciprocity” becomes the new trade standard.
Lesotho—an AGOA beneficiary—was accused of slapping the U.S. with 99% tariffs in return. On paper, Trump’s demand for reciprocity might sound fair. But the data tells a different story.
A reality check
According to official WTO data, no African country comes close to charging 99% tariffs on U.S. goods. Most charge between 5% and 15% on average. Mauritius, for example, reportedly charging the U.S. 80%, has an average applied tariff of just 0.8%. Lesotho, accused of levying 99% duties, averages just 7.5%—even lower when trade-weighted.
The new tariffs affected over 30 African countries, but we decided to zero in on the top 10, which supposedly charge above 20% tariffs to the U.S. We looked at the simple average tariffs and the trade weighted tariffs with most-favoured nation (MFN) applied.
Here’s a side-by-side comparison of the Trump administration’s claims and the WTO-reported facts for the top 10 targeted African countries:
Lesotho
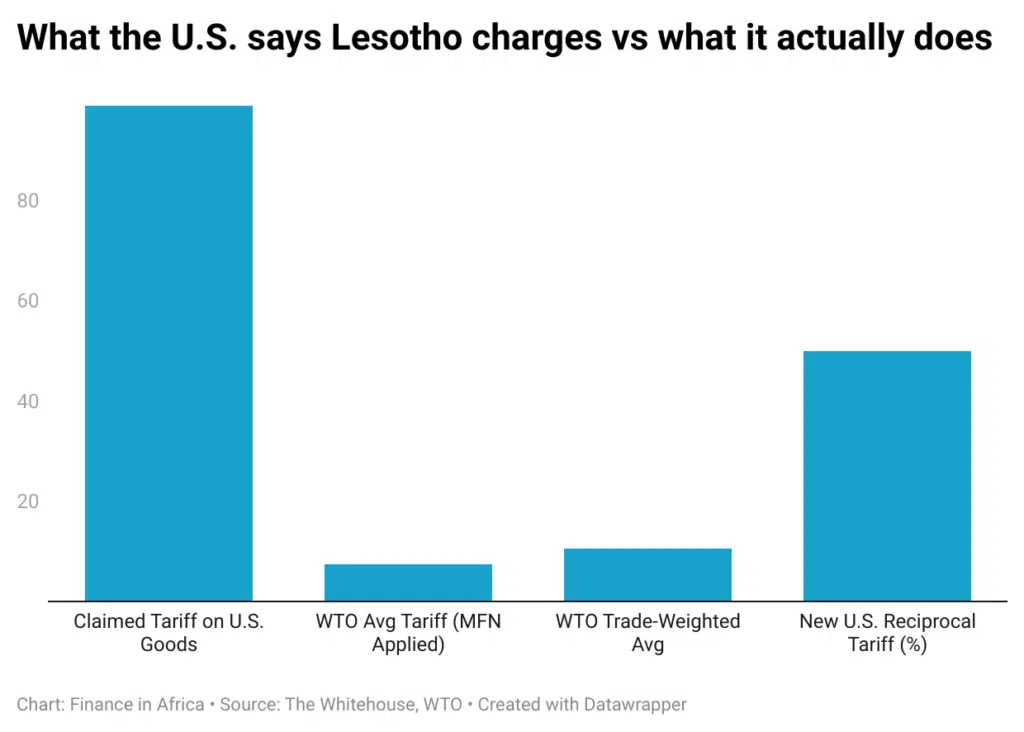
- Claimed Tariff: 99%
- WTO Avg Tariff (MFN Applied): 7.5%
- WTO Trade-Weighted Avg: 10.6%
Lesotho’s economy heavily depends on textiles and garments—over 80% of which are exported to the U.S. under AGOA. According to WTO data, in 2022, the U.S. imported $372 million worth of non-agricultural goods from Lesotho.
Lesotho faced a simple average tariff of 17.1%, but a weighted tariff of 18.9% on its exports to the U.S.—reflecting its narrow export basket. Despite that, 97.7% of tariff lines and 100% of total U.S. import value entered duty-free, largely due to AGOA preferences.
Trade data from 2023 shows Lesotho exported $228 million worth of goods to the United States, dominated by diamonds ($56.1M), knit women’s suits ($47.9M), and knit men’s suits ($32.9M). The U.S., in contrast, exported just $7.33 million to Lesotho, mostly in delivery trucks, vaccines, and industrial machinery.
Looking at Lesotho’s MFN applied tariff schedule, duties on products like mechanical and office machinery and electrical equipment—core components of U.S. exports—range between 3.5% and 6.8% on average, with most imports in those categories entering duty-free between 62–95% of the time.
So, while there are bound ceilings in Lesotho’s tariff schedule as high as 60%, the effective tariffs charged on U.S. machinery are both low and largely exempted.
The 99% figure quoted by the U.S. administration does not appear anywhere in WTO or AGOA reporting and seems to be based on a trade-deficit balancing model, not on actual tariffs charged. But more on that later.
Madagascar
- Claimed Tariff: 93%
- WTO Avg Tariff (MFN Applied): 12.0%
- WTO Trade-Weighted Avg: 8.1%%
Madagascar’s trade profile is concentrated around a few high-volume exports, such as vanilla, non-knit men’s suits, and non-knit men’s shirts—all of which enter the United States under preferential terms.
In 2023, Madagascar exported $669 million to the U.S., down from $876 million in 2018. Meanwhile, the U.S. exported $107 million to Madagascar, primarily in valves ($21.2M), liquid pumps ($16.2M), and sorghum ($8.2M).
According to WTO data, Madagascar applies a simple average MFN tariff of 12.0%, with a trade-weighted average of 8.1%. For non-agricultural products—which include most U.S. exports—the rates are even lower.
‘Specifically, mechanical equipment faces an average tariff of 6.3%, electrical machinery 11.4%, and transport equipment 9.6%. The share of such imports entering duty-free stands at 8.2%, 4.0%, and 14.9%, respectively.
Conversely, the United States offers highly preferential access to goods from Madagascar. As of 2022, 100% of Madagascar’s agricultural exports and 99.8% of its non-agricultural exports entered the U.S. duty-free, largely thanks to AGOA benefits and the U.S.’s low applied tariff structure.
Here again, the Trump administration’s 93% figure appears to be based on a formula balancing trade deficits, not on actual tariffs.
Mauritius
- Claimed Tariff: 80%
- WTO Avg Tariff (MFN Applied): 0.8%
- WTO Trade-Weighted Avg: 1.3%
One of Africa’s most open economies, Mauritius has long maintained minimal tariffs to encourage trade. It has an FTA with China and deep U.S. trade links—making the 80% claim especially misleading.
In 2023, Mauritius exported $299 million to the United States, largely in diamonds ($89.6M), other animals ($66.5M), and processed fish ($30.1M). That figure has declined modestly over the past five years from $335M in 2018.
Meanwhile, the U.S. exported $155 million to Mauritius in 2023, mostly in magnesium carbonate ($37.8M), petroleum gas ($25.8M), and medical instruments ($6.9M). These products fall under categories where Mauritius applies virtually no MFN tariffs (between 98 – 100% of items enter duty-free).
According to WTO data, Mauritius maintains an average MFN applied rate of just 0.8%, and the trade-weighted average is only 1.1%. Across all major product categories, the U.S. faces zero tariffs on nearly 100% of agricultural and industrial lines.
Botswana
- Claimed Tariff: 74%
- WTO Avg Tariff (MFN Applied): 7.5%
- WTO Trade-Weighted Avg: 5.6%
Botswana’s export relationship with the U.S. is dominated by diamonds, which made up $456 million of its $459 million in exports to the U.S. in 2023. Other exports included synthetic jewellery stones and spark-ignition engines.
The U.S., on the other hand, exported just $87.3 million worth of goods to Botswana, including diamonds ($25.9M), carboxyamide compounds ($11.6M), and large construction vehicles ($5.6M).
According to WTO records, Botswana charges a simple average MFN tariff of 7.5%, with a trade-weighted average of 5.6%. These rates are a far cry from the 74% claimed by the Trump administration.
Botswana’s goods, not U.S. exports, are the beneficiaries of AGOA. Nearly all Botswana goods enter the U.S. duty-free, with 100% of agricultural tariff lines and 99.5% of non-agricultural lines covered under AGOA and SACU-related arrangements.
For U.S. machinery and equipment exports to Botswana, WTO data shows:
- 1.0% tariff on mechanical machinery
- 4.8% on electrical equipment
- 6.8% on transport equipment
These categories also enjoy high duty-free entry rates of 92.9%, 67.0%, and 62.0%, respectively.
Once again, the 74% figure appears untethered from actual trade data or WTO schedules and seems to be derived from a trade-deficit-based model rather than actual tariff lines.
Angola
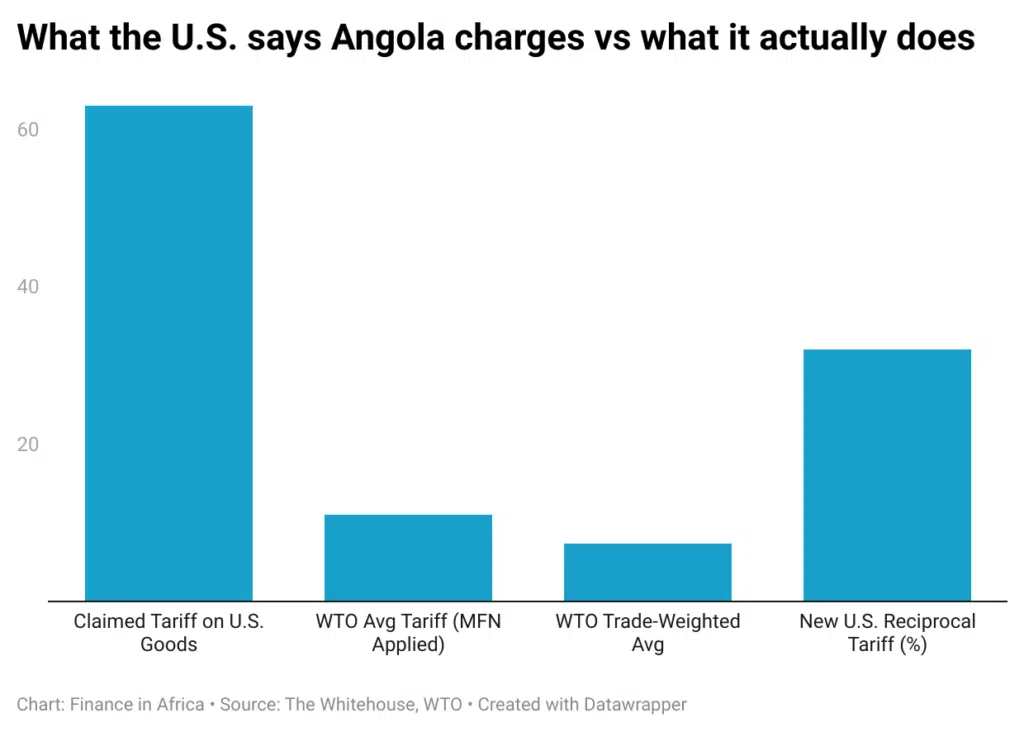
- Claimed Tariff: 63%
- WTO Avg Tariff (MFN Applied): 11%
- WTO Trade-Weighted Avg: 7.3%
Angola exports primarily oil to the U.S., which is generally zero-rated. The average tariff covers other sectors like beverages and manufactured goods—none close to the claimed rate.
The trade relationship between Angola and the United States is governed by a Trade and Investment Framework Agreement (TIFA) signed in 2009. The first U.S.-Angolan Council on Trade and Investment meeting was held in June 2010 in Luanda.
In 2024, total goods trade between the two countries reached $2.6 billion. U.S. exports to Angola stood at $682.4 million, up 13.9% from the previous year, largely driven by exports of refined oil, heavy machinery, and agricultural products.
Meanwhile, U.S. imports from Angola—predominantly crude oil and diamonds—climbed to $1.9 billion, up 61% from 2023. As a result, the U.S. trade deficit with Angola grew to $1.2 billion, nearly doubling year-over-year.
Despite the trade imbalance, Angola does not impose disproportionately high tariffs on U.S. goods. Its WTO MFN simple average is 11.0%, and the trade-weighted average is just 7.3%—well below the 63% claimed by the Trump administration. Angola has diversified its trade away from the US, and is not one of the country’s top 5 trading partners.
Angola’s applied tariffs on machinery-related imports—core U.S. exports—are in line with WTO norms, and some enter duty-free under targeted industrial exemptions.
Once again, the U.S. reciprocal tariff response appears to be based on broad assumptions rather than specific tariff schedules or actual access conditions.
Libya
- Claimed Tariff: 61%
- WTO Avg Tariff (MFN Applied): 4.0%
- WTO Trade-Weighted Avg: Libya is not a full WTO member.
- Libya’s trade with the U.S. is minimal and mostly limited to energy services. Its tariff structure has remained consistent over the past decade.
With just observer status, Libya is not a full member of the World Trade Organization, but it maintains a simple average applied tariff of just 4.0%, well below the 61% claimed by the Trump administration. There is no available trade-weighted average, But the US’ claim is still difficult to justify.
In 2024, total goods trade between Libya and the United States was $2.0 billion. The U.S. exported $567.2 million worth of goods to Libya—up 27.1% from 2023—led by cars, industrial machinery, and agricultural products.
U.S. imports from Libya in 2024 totaled $1.5 billion, largely consisting of crude oil, down 4.6% from the previous year. The result was a U.S. goods trade deficit of $898.3 million, which actually narrowed by 17.6% year-over-year.
Despite the trade imbalance, there is no evidence that Libya imposes high or protectionist tariffs on U.S. goods. On the contrary, available data suggests relatively liberal trade policies on most industrial and consumer categories.
South Africa
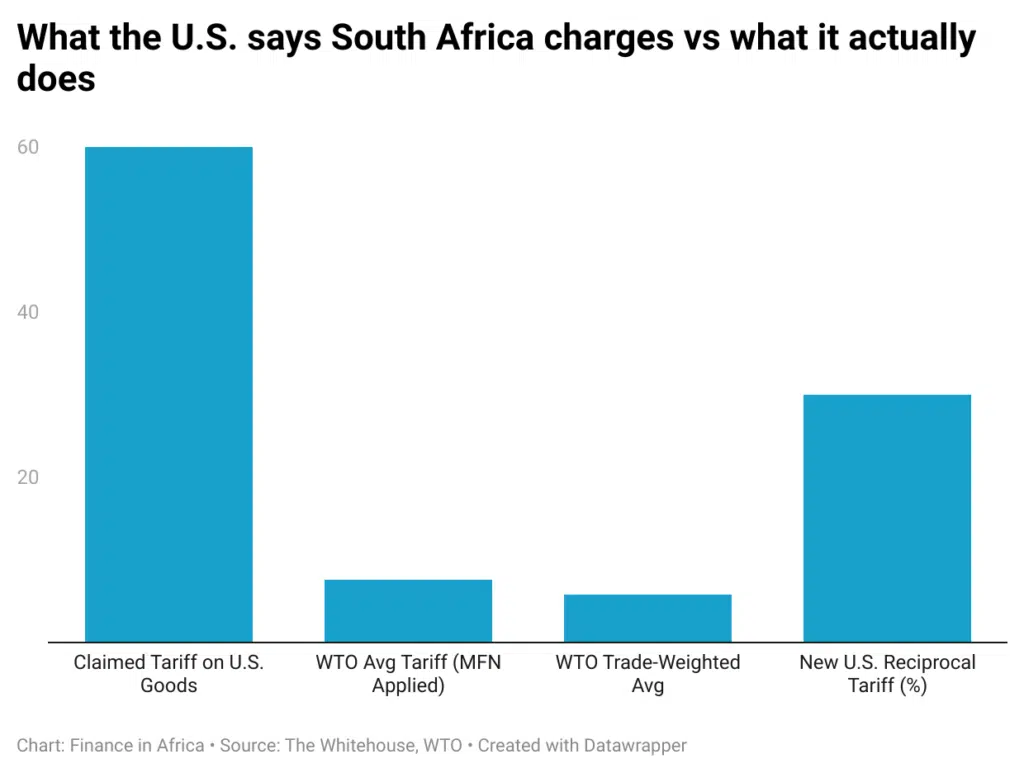
- Claimed Tariff: 60%
- WTO Avg Tariff (MFN Applied): 7.8%
- WTO Trade-Weighted Avg: 6.3%
As Africa’s most industrialised economy, South Africa has longstanding bilateral ties with the U.S. and benefits from AGOA. Tariffs are low across manufacturing and autos.
In 2024, total goods trade between the United States and South Africa was $20.5 billion. U.S. exports to South Africa amounted to $5.8 billion, a decline of 18.3% from 2023, with decreases in aircraft, machinery, and agricultural products. Tariffs range from 1% to 6.8%.
U.S. imports from South Africa totaled $14.7 billion, an increase of 4.9% over the previous year, primarily consisting of precious metals, vehicles, and minerals.
This resulted in a U.S. goods trade deficit with South Africa of $8.8 billion, a 29.0% increase compared to 2023.
South Africa’s average applied MFN tariff is 7.6%, with a trade-weighted average of 5.8%, significantly lower than the 60% claimed by the Trump administration.
The African Growth and Opportunity Act (AGOA) has facilitated duty-free access for many South African exports to the U.S., benefiting sectors like automotive, textiles, and agriculture.
Algeria
- Claimed Tariff: 59%
- WTO Avg Tariff (MFN Applied): 11.8%
- WTO Trade-Weighted Avg: 9.2%
Algeria applies higher tariffs in agriculture and consumer goods, but no segment justifies a 59% average. U.S. trade is largely in hydrocarbons and equipment.
In 2024, total goods trade between the United States and Algeria was valued at $3.5 billion. The U.S. exported $1.0 billion worth of goods to Algeria, a 15.5% decline from 2023, driven by lower volumes of industrial equipment, wheat, and petroleum-related products.
U.S. goods imports from Algeria totaled $2.5 billion in 2024, down 18.7% from the previous year. Imports are primarily composed of crude oil, fertilisers, and inorganic chemicals.
The U.S. trade deficit with Algeria stood at $1.4 billion, a 20.9% improvement compared to 2023, reflecting declining import demand.
While Algeria’s average tariff is among the higher ones in Africa at 18.0%, it is still significantly lower than the 59% figure claimed by the Trump administration.
Algeria maintains a highly centralised trade policy, with import bans and licensing restrictions in some sectors. But this does not translate into across-the-board tariffs anywhere near the levels suggested in the U.S. retaliatory chart.
Tunisia
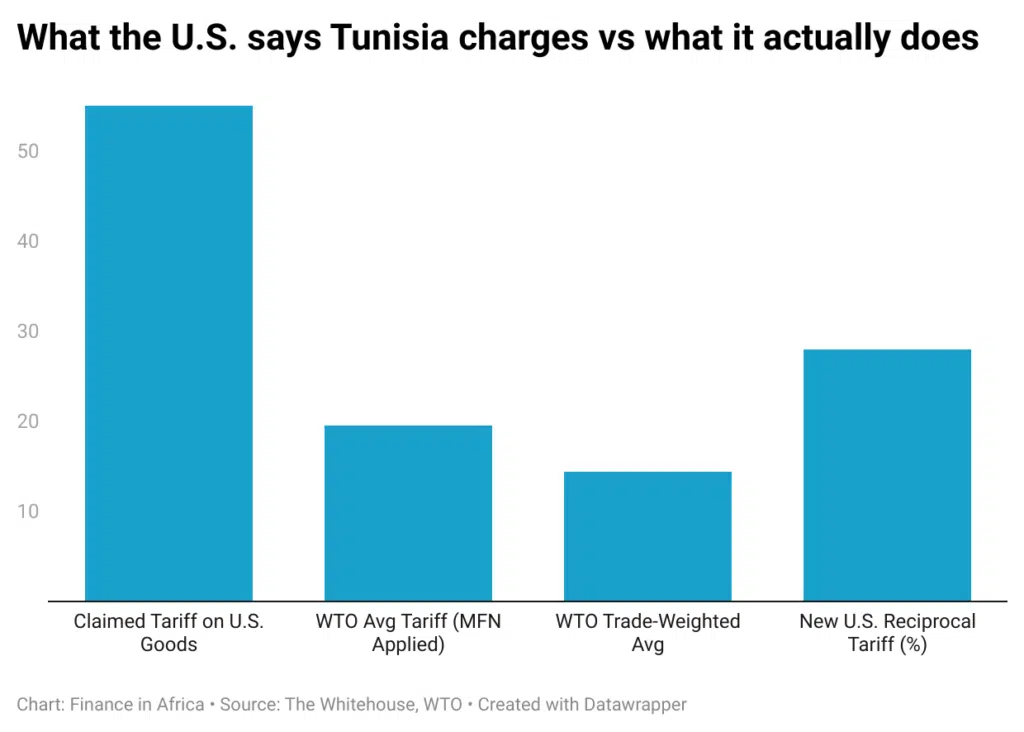
- Claimed Tariff: 55%
- WTO Avg Tariff (MFN Applied): 19.5%
- WTO Trade-Weighted Avg: 14.4%
Tunisia’s economy is export-driven with close EU integration. Tariffs on U.S. goods average within global norms.
In 2024, the total goods trade between the U.S. and Tunisia reached $1.6 billion. U.S. exports to Tunisia amounted to $503.6 million, a decline of 8.9% from 2023, led by reduced shipments of grains, aircraft parts, and industrial machinery.
U.S. imports from Tunisia totalled $1.1 billion, a 30.4% increase over 2023, largely made up of apparel, olive oil, and phosphate-based products.
The resulting U.S. trade deficit with Tunisia stood at $619.6 million, up 100.8% from the previous year.
Tunisia’s average applied MFN tariff is 19.5%, with a trade-weighted average of 14.4%—higher than most countries in the region but still well below the 55% claimed by the Trump administration.
Tunisia’s tariff profile reflects its dual-track economy: some sectors remain highly protected, particularly agriculture and processed goods, while others—especially manufactured exports under offshore regimes—are liberalised to attract foreign investment.
The U.S. retaliation appears disproportionate when compared to Tunisia’s actual applied rates, especially given that many U.S. exports—such as aircraft parts and medical goods—face little to no tariffs under special import programs.
Cote d’Ivoire
- Claimed Tariff: 41%
- WTO Avg Tariff (MFN Applied): 12.3%
- WTO Trade-Weighted Avg: 10.8%
- The U.S. imports cocoa and cashew from Côte d’Ivoire, mostly duty-free under AGOA. The average MFN tariff rate is far below the claimed figure.
In 2024, total goods trade between the United States and Côte d’Ivoire amounted to $1.6 billion. U.S. goods exports to Côte d’Ivoire were $596.6 million, up 15.6% from 2023, with key exports including petroleum gas, acyclic hydrocarbons, and ethylene polymers.
The Observatory of Economic Complexity
U.S. goods imports from Côte d’Ivoire totaled $1.0 billion, a 7.0% increase from the previous year, primarily comprising cocoa, natural rubber, and cashew nuts.
The U.S. goods trade deficit with Côte d’Ivoire was $403.4 million in 2024, a 3.2% decrease compared to 2023.
Côte d’Ivoire’s simple average MFN applied tariff is 12.1%, with a trade-weighted average of 7.7%, both significantly lower than the 41% claimed by the U.S. administration.
WTO Trade Database
The discrepancy between the claimed and actual tariff rates suggests that the figures presented by the U.S. administration may not accurately reflect Côte d’Ivoire’s tariff regime.
So where did these numbers come from?
Press Secretary Kush Desai defended the administration’s numbers by saying, “we literally calculated tariff and non-tariff barriers.” He shared a formula showing how the administration derived these new rates.
But that formula doesn’t measure foreign tariffs. Instead, it uses a country’s trade imbalance with the U.S. to set a new tariff level that would (in theory) eliminate the deficit. It’s built around this equation:
Where:
- =U.S. exports to country i
- = U.S. imports from country i
- = elasticity of imports
- = pass-through of tariffs into prices
In simple terms, the bigger the trade imbalance, the bigger the tariff. There’s no variable here for actual foreign tariff levels.
So, while the press secretary claims the tariffs are based on what African countries charge, the math says they’re based on what the U.S. buys more than it sells.
What about AGOA?
Many of these countries—like Lesotho and Madagascar—have benefited from AGOA, a U.S. trade preference program that allows duty-free exports for eligible African countries. AGOA was designed to support export-led development. Its rules are reviewed every few years, and its future has always depended on U.S. political will.
The Trump tariffs don’t formally repeal AGOA, but in practice, they undermine it. Countries that previously enjoyed duty-free access are now being hit with 30–50% tariffs—often with little warning or transparency.
In effect, this marks a sharp break from the development-first, market-access approach that has shaped U.S.- Africa trade policy since the early 2000s.